


Austin's MetroBike is undergoing major changes. How's it going?
After over a decade of bikeshare experiments, Austin is finally executing on a bold vision for an electric-bike future.

CapMetro has paused the MetroBike program to rapidly expand the system this summer, which presents us with a perfect time to take stock of how the program has evolved over the last decade or so. 2013 marks the first year in Austin that a brave cyclist could open their phone and rent a bike from a kiosk right on the street. This was four years prior to Bird’s notorious debut of the scooters that littered our city sidewalks and waterways. Even Uber was just getting their foothold, having not even launched in our fair city. The sharing economy was in its infancy and BCycle, a national bikeshare franchise that partnered with Austin in the early years of our city bikes, was very much a novelty. You simply pulled out your phone, downloaded their app, typed in your payment info and then you could just…. take them. 110 bikes with locking kiosks appeared on our streets, particularly near the UT campus, and the grand experiment began.
CapMetro took over the program as an official part of their transit portfolio in 2016 (though the city still partners with BCycle for bike aquisition and disposal), and a rapid expansion saw huge jumps in ridership and kiosk construction between 2017 and 2018. A few short years later, the pandemic threw Austin’s transit authority into the same limbo that struck every entity on the planet; ridership on all modes of transit plummeted and the future of many agencies was put into question. Immediately prior to the this difficult period for CapMetro, a decision was made to completely change the direction of the MetroBike program and push for a fully-electrified bike fleet. This choice worried many transit watchers, as CapMetro’s reputation for successfully executing on bold plans is… not exactly impressive.
I’m pleased to report that MetroBike’s transition to a futuristic Jetsons-esque service is well underway. I’ve been pouring over some of this data today and I’m excited to share a few of my basic findings about the health and reach of this exciting program. MetroBike is currently paused as the city rapidly expands bike kiosks around the city, with planned reopening of the program in November.
All data has been pulled from City of Austin’s online data portal, the dataset is here. As always, CasaGraphica images are open-source, free to use, reuse and remix as you see fit. 2024 numbers are projected as double the January-June ‘24 data, as we are conveniently halfway through the year. You can see my number-crunchy analysis spreadsheet here if you’d like to play around with the analytical findings yourself.

The basic ridership numbers tell a pretty clear story of a successful launch, followed pretty quickly by a pullback and change of direction for the program in 2019-2020 followed by renewed rapid growth.
(Before we move on to the electric bike data, it should be noted that the flat growth between ‘23 and ‘24 is an artifact of my projection method. Because the program will be paused for many months, real ‘24 numbers will likely be much lower, but have been projected to not show the CapMetro mandated slowdown so ridership so far in ‘24 can be more accurately represented.)
By themselves these data might look like a temporary retreat rather than a bold new choice for this agency, but when you compare manual bikes to electric bikes, it’s easy to see the transition that took place in those years.

The data demonstrates that in 2019 CapMetro began winding down its manual fleet and quickly purchasing their electric fleet over the following years. I do love this chart because it refutes a popular argument against the expansion of this program or bike infrastructure as a whole: that people don’t want to ride bikes in Austin’s heat. In 2018 we set all-time ridership records with only a handful of electric bikes in our fleet. This was an incredible proof of concept, and we did it with human-power, despite our occasionally oppressive weather. As you can see, ridership DOES fall during the hottest summer and coldest winter months, but so does tourism, which can definitely account for some of that drop. Here’s the monthly breakdown of ridership visualized:

One observation: in early years our spring spike would be the largest of the year, coinciding with SXSW in the springtime. Since the introduction of the electric fleet, we seem to have a trend of larger ridership spikes in the fall months. We will sadly have to wait until 2025 to see if this trend continues in the data.
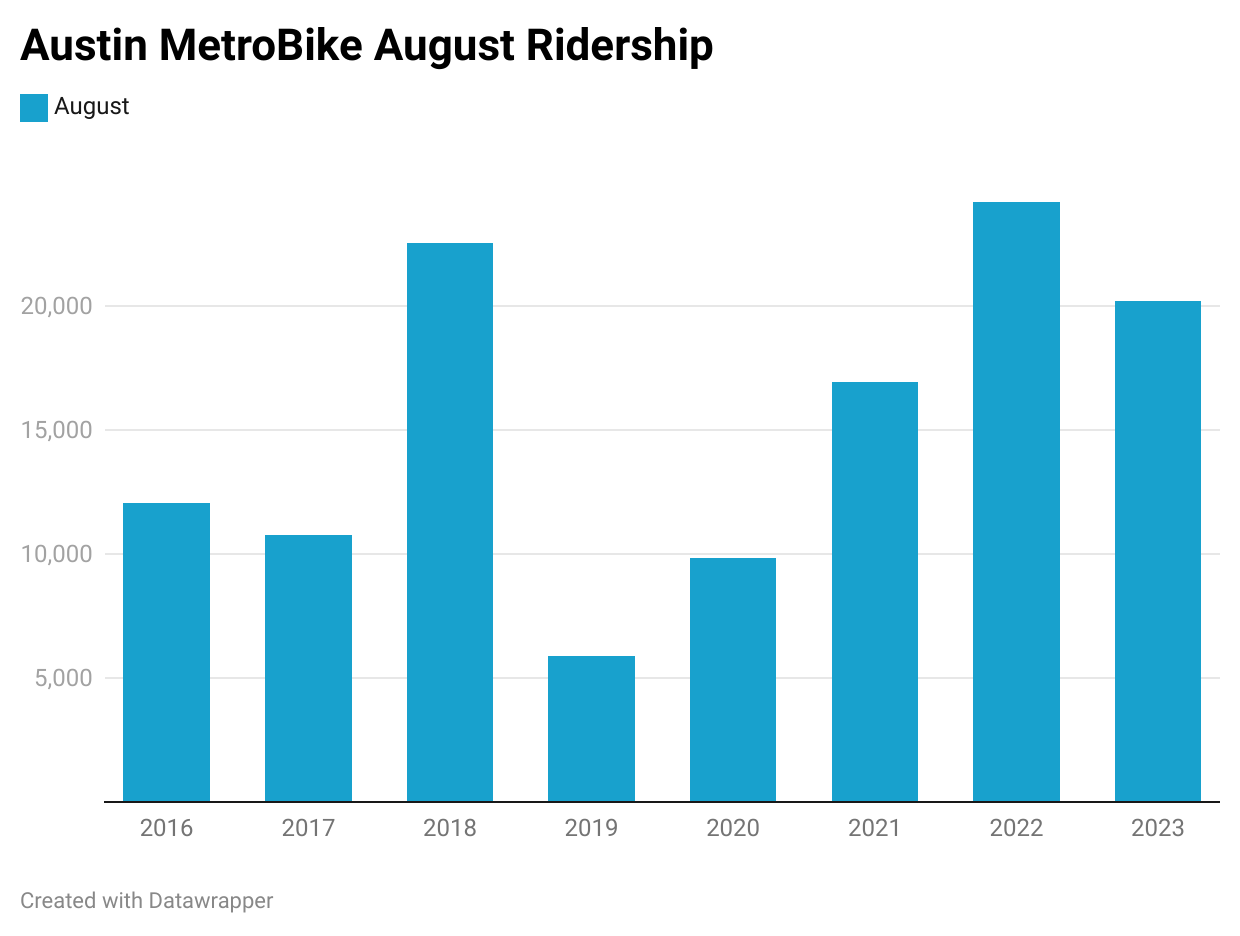
The summer lull is understandable; today it reached 103F. But people aren’t giving up on biking, despite the heat, and since introducing the electric fleet, ridership in summertime is on the rise, with a small pullback in August last year.
One aspect that interested me is exactly how people are using the MetroBike Program. Are people going on short joyrides? Commuting to work? Leaving their car parked illegally downtown and cycling home drunkenly? Luckily, we have lots of good data to get a feel for this.

From the very beginning, the vast majority of bike trips were point A to point B, which I’ve identified as “commuter” trips. Riders who check bikes out of a kiosk and return it to the same kiosk could be interpreted as “recreational” trips, or people just checking the service out. As you can see, during the pandemic, people taking bikes out for a spin for fun or excercise grew significantly in popularity, reaching almost a quarter of MetroBike users. Since then, people are increasingly using the bikes for point A to point B transit, the stated goal of the program, reaching 93% so far in 2024.

Trip length is another metric we can look at to see how people are using the service. As you can see, high ridership years are also short trip lenth years. This tells us that the more people use MetroBike, the more viable it is perceived as a quick and convenient way to get around the city. Coming back to our pandemic years, we can observe that MetroBike riders were in no hurry to get back to their check out kiosk. The average is even starker than the median, with average trip length exceeding 45 minutes in 2020. As many may recall, outdoor activities were a source of solace and relief during the era of social distancing, and the data clearly shows that for many Austinites, MetroBike was an essential part of that.
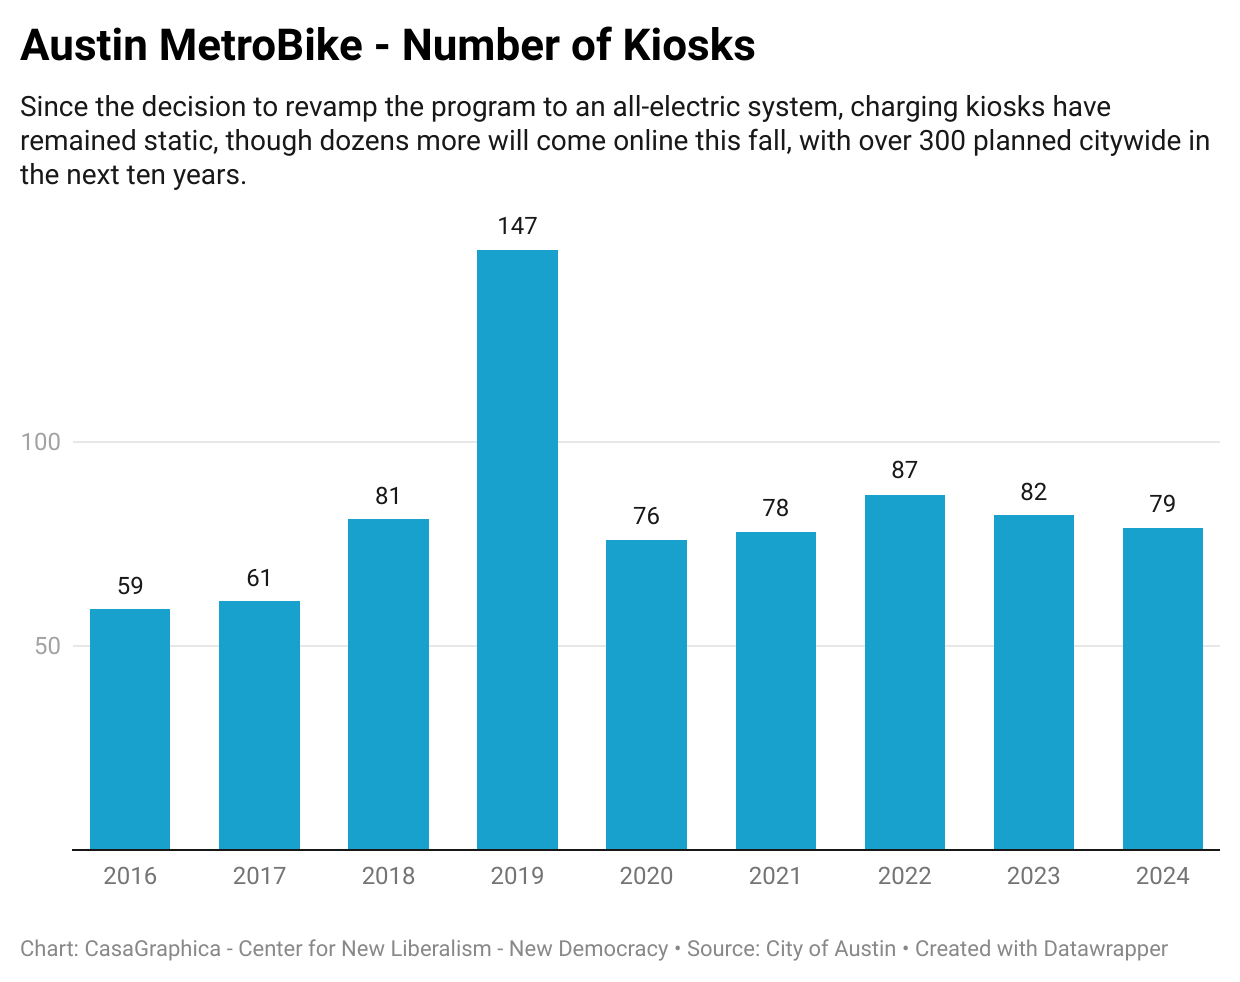
Because we are only halfway through 2024, the incredible growth in kiosks that is happening now has not borne out in the data or visualization I’ve created. Currently CapMetro is installing four new stations every day, fully fitted with electric chargers. If everything goes well, our 2024 stats will show a record number of kiosks for the year, as Austinites get back to MetroBiking this winter.
CapMetro’s plans to install 300 electric bike kiosks around the city within the next ten years is ambitious, but seems to be proceeding much better than previous expansions of Austin’s transit network.
Overall, MetroBike is healthy and expanding apace, something that simply can’t be said for our bus or train services in Austin. The agency currently plans to spend about $20 million over the next ten years on the program, which is a tiny fraction of the overall budget. 2.3 Million people rode CapMetro buses in 2023, so MetroBike has a LONG way to go to overtake most people’s preffered transit mode, but Austinites can be proud that we’re expanding our two-wheeled tansit options as rapidly as we’re jacking up the prices of frozen margaritas.
Stay cool out there, riders.
For some more interesting data analysis of this same dataset, please see Mandy McClintock’s great medium article . She delves much more into location data, and comes to some great insights.
Mike Wainwright is a Board Member of Austin New Liberals and creator of CasaGraphica, a project to understand the data behind housing, transit and urbanism in Austin.